
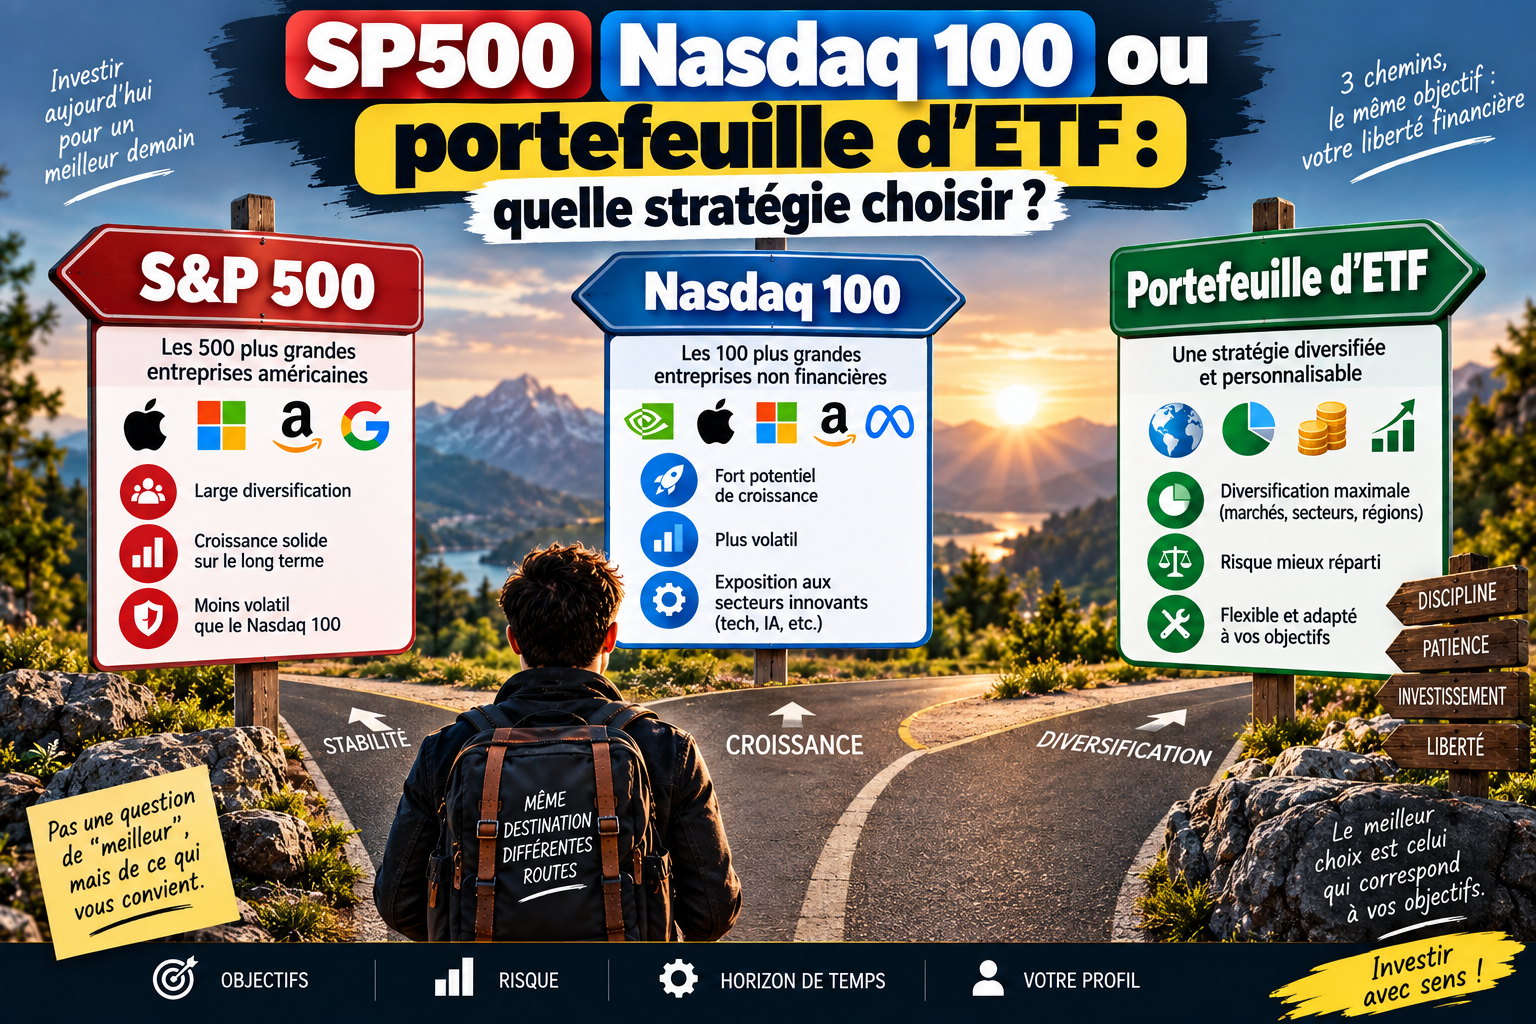
When you start investing, one question always comes up:
Should we seek maximum performance or aim for a sustainable strategy? Indeed, the real question of this article is: SP500, Nasdaq 100 or ETF portfolio: which strategy to choose? The question is whether it's better to simply invest in an S&P 500, a Nasdaq 100 ETF, or to try to beat the stock market with a few ETFs?
Recommended products


⚠️ The simulations presented in this article are based on average historical returns and observed volatility in the markets.
These examples are neither a forecast nor financial advice, but rather an educational illustration of different investment strategies. Investing can involve the risk of losing money. This article should not be considered investment advice.

Introduction
When you start investing in the stock market, a few questions arise:
- Should we seek maximum performance or build a more diversified and sustainable strategy?
- Is it better to simply invest in an ETF that tracks the S&P 500?
- Should we favor the Nasdaq 100 to benefit more from the growth of large technology companies?
- Is it better to combine several ETFs to create a more personalized portfolio?
In this article, we will compare three investment strategies:
- 100% S&P 500 with the VOO ETF
- 100% Nasdaq 100 with the QQQ ETF
- A portfolio composed of several ETFs, with significant exposure to the United States, but also exposure to large growth companies, global markets, Swiss equities and companies paying high dividends.
The goal is not to determine one strategy that is universally better than others. Rather, it is to understand the advantages, limitations, and historical results of each approach.
⚠️ The simulations presented in this article are based on historical returns observed under certain calculation assumptions. They do not constitute a forecast or financial advice. Past performance is not indicative of future results. Investing in the stock market involves the risk of capital loss.
Example comparing three investors with the same starting amount
Let's imagine three investors.
Everyone invests 100,000 USD at the beginning of the period studied (2016-2025) and retains its investment for ten years.
During this period:
- No investor adds any money
- the dividends are reinvested
- ETFs are held for the long term
- The portfolio, composed of several ETFs, is regularly rebalanced to maintain its initial weightings.
The goal is to understand how much each investor could have earned after ten years with a different strategy.
Later in the article, we will also analyze what might happen if each investor started withdrawing a portion of their portfolio each month as part of a FIRE strategy.
Simulation between three investors: S&P 500, Nasdaq 100 and ETF portfolio
Investor 1 – 100% S&P 500
Allocation
- 100% ETF VOO
VOO is an ETF that tracks the S&P 500 index.
This strategy is extremely simple: the investor buys a single ETF and gains exposure to large American companies.
The S&P 500 comprises approximately 500 large publicly traded companies in the United States. It offers diversification across several sectors, for example:
- technology
- health
- finance
- the industry
- energy
Even though the portfolio contains several hundred companies, it remains fully exposed to the US market.
| Characteristic | S&P 500 ETF |
|---|---|
| Strategy | Diversified in the United States |
| Number of shares | Approximately 500 |
| Main region | UNITED STATES |
| Concentration level | Moderate |
| Volatility | Average |
| Historic dividends | Approximately 1 to 2 % per year |
| Number of ETFs | 1 |
👉 This strategy is particularly suitable for investors who are looking for simplicity, good diversification in US equities and wish to avoid managing multiple ETFs.
Investor 2 – Aiming for growth with the Nasdaq 100
Allocation
- 100 % ETF QQQ
QQQ tracks the Nasdaq-100, an index composed of large non-financial companies listed on the Nasdaq.
The Nasdaq 100 is heavily weighted towards technology and growth companies. It includes companies active in:
- software
- semiconductors
- artificial intelligence
- digital services
- telecommunications
The Nasdaq 100 has performed exceptionally well over the past decade. However, its high returns have been accompanied by significant concentration in a few large American companies.
| Characteristic | Nasdaq 100 ETF |
|---|---|
| Strategy | American Growth |
| Number of shares | Approximately 100 |
| Main region | UNITED STATES |
| Technology Exhibition | Very high |
| Volatility | High |
| Historic dividends | Generally low (approximately 0.5%) |
| Number of ETFs | 1 |
👉 The Nasdaq 100 may offer superior growth potential, but it can also experience significant declines and long periods of underperformance.
Investor 3 – Diversified ETF Portfolio
I simulated investor 3 with this diversified ETF portfolio:
| AND F | Weighting |
|---|---|
| VOO – S&P 500 | 30 % |
| QQQ – Nasdaq 100 | 30 % |
| VT – Global Equities | 10 % |
| MGK – Large American Growth Companies | 10 % |
| CHDVD – Swiss Dividend Shares | 10 % |
| VHYL – Global High Dividend Stocks | 5 % |
| VYM – High Dividend US Stocks | 5 % |
| Total | 100 % |
👉 This strategy combines several approaches:
- 30 % in VOO, to gain exposure to a very large part of the American stock market (approximately 80%)
- 30% in QQQ, in order to focus on the 100 best US growth stocks according to Nasdaq
- 10 % in MGK, in order to increase exposure to large American growth companies
- 10 % in VT, in order to achieve global diversification
- 10 % in CHDVD, in order to add exposure to Swiss companies and Swiss dividends
- 5 % in VHYL, in order to invest in global companies paying high dividends
- 5 % in VYM, in order to add high-dividend American companies.
This portfolio is more complex than VOO or QQQ alone. It contains several thousand underlying stocks thanks to global ETFs.
However, it's important to understand that a high number of stocks doesn't mean the portfolio is perfectly balanced across regions. In fact, approximately 85% of this portfolio is invested in the United States.
The wallet is therefore diversified by the number of companies and it is approximately 15% invested outside the USA, but remains heavily focused on the United States and large American growth companies.
Here is a summary of the portfolio:
| Characteristic | ETF portfolio |
|---|---|
| Strategy | Mixing Growth, Diversification and Dividends |
| Number of ETFs | 7 |
| Number of underlying shares | Several thousand |
| Main region | United States (approximately 85 %) |
| International Exhibition (Switzerland included) | Present (approximately 15 %) |
| Swiss Exhibition | Present (Approximately 7 %) |
| Volatility | Rather High |
| Estimated dividends | Approximately 1 % to 1.5 % per year |
Summary of the three strategies
| Strategy | Approximate number of shares | Dominant region | Complexity | Main objective of the strategy |
|---|---|---|---|---|
| S&P 500 – VOO | Approximately 500 | UNITED STATES | Very weak | US Diversified Growth |
| Nasdaq 100 – QQQ | Approximately 100 | UNITED STATES | Very weak | US growth with high volatility |
| ETF portfolio | Several thousand | United States with international diversification | Average | US growth, but diversified with a global strategy and high dividends |
👉 The ETF portfolio has the largest number of companies and the greatest geographical diversity.
However, one should not confuse diversification And lack of concentration.
The VOO, QQQ, and MGK positions overlap significantly. Large, high-growth US companies represent a very substantial portion of the portfolio.
The 10 main actions of each strategy
Before examining the performance of each strategy, I thought it would be helpful to analyze the top 10 stocks and their weight in the portfolio.
Note that the percentages below are estimates and may change depending on the markets and ETF weightings.
| Rank | VOO – S&P 500 | QQQ – Nasdaq 100 | ETF portfolio |
|---|---|---|---|
| 1 | Apple – ~7 % | NVIDIA – ~9 % | NVIDIA – ~6 to 7 % |
| 2 | Microsoft – ~6 % | Microsoft – ~8 % | Apple – ~6 % |
| 3 | NVIDIA – ~6 % | Apple – ~8 % | Microsoft – ~6 % |
| 4 | Amazon – ~4 % | Amazon – ~6 % | Amazon – ~4 % |
| 5 | Meta – ~3 % | Broadcom – ~5 % | Broadcom – ~3 % |
| 6 | Alphabet – ~3 % | Meta – ~5 % | Meta – ~3 % |
| 7 | Broadcom – ~2 % | Alphabet – ~5 % | Alphabet – ~3 % |
| 8 | Tesla – ~2 % | Tesla – ~3 % | Tesla – ~2 % |
| 9 | Berkshire Hathaway – ~2 % | Netflix – ~2 % | Nestlé – ~1 % |
| 10 | Eli Lilly – ~1.5 % | Costco – ~2 % | Roche – ~1 % |
The ten main actions represent approximately:
- VOO: 35 % to 40 % of the portfolio
- QQQ: 50 % to 55 % of the portfolio
- ETF portfolio: 30 % to 35 % of the portfolio
👉 The Nasdaq 100 is the strategy most concentrated on large technology companies.
The ETF portfolio has less exposure to the top 10 stocks and also international exposure; for example, we see Swiss stocks in the top 10. This is not the case with the VOO or QQQ ETFs.
However, it remains heavily exposed to large American companies such as the VOO ETF or QQQ.
👉 The ETF portfolio is therefore more diversified than QQQ and VOO., but its performance remains largely influenced by large American growth companies.
S&P 500 vs Nasdaq 100 vs ETF portfolio
Simulation of historical returns
Let's imagine that the three investors had placed 100,000 USD at the beginning of the period studied.
Note that they did not add any additional money and reinvested all dividends.
For this comparison, we use ten-year estimates (2016-2025):
| Strategy | Estimated annualized compound return |
|---|---|
| VOO – S&P 500 | Approximately 14.8 % |
| QQQ – Nasdaq 100 | Approximately 19.5 % |
| ETF portfolio | Approximately 15.5 % |
The return of the ETF portfolio is an estimate based on the historical performance of the ETFs that compose it, with regular rebalancing.
Results may vary depending on:
- the exact dates used
- the frequency of rebalancing
- the reference currency
However, we conclude that the order of returns is:
- QQQ
- ETF portfolio
- S&P 500
The ETF portfolio has historically outperformed the S&P 500. However, it has remained significantly behind the Nasdaq 100 during this period.
However, caution is necessary.
The last decade has been particularly favorable to major American technology companies. The Nasdaq 100 has benefited from this trend. However, this does not automatically mean it will be the best investment over the next ten years.
Simulation in figures with an initial investment of USD 100,000
Here is a simplified simulation based on estimated annualized returns, assuming an initial investment of USD 100,000.
| Initial amount | Strategy | Estimated annualized return | Theoretical amount after ten years |
| 100,000 USD | S&P 500 – VOO | 14,8 % | Approximately USD 397,000 |
| 100,000 USD | Nasdaq 100 – QQQ | 19,5 % | Approximately USD 592,000 |
| 100,000 USD | ETF portfolio | 15,5 % | Approximately USD 422,000 |
These amounts are theoretical and assume:
- a one-time investment of USD 100,000
- reinvestment of dividends
- no withdrawal
- no tax
- No brokerage fees
- no exchange fees
The difference between the ETF portfolio and VOO would therefore be relatively small over ten years. Although the ETF portfolio gained approximately $25,000 more over 10 years, that's not insignificant.
However, the gap with QQQ would be much larger.
This shows the power of compound interest: a few percentage points of annual return can produce a considerable difference after several years.
Why did the ETF portfolio perform better than VOO?
The wallet contains:
- 30 % of QQQ
- MGK 10 %
- 30 % from VOO
It is therefore heavily exposed to large, growing American companies. During the period studied, these companies experienced very strong growth.
The portfolio also benefited from shares in VT, CHDVD, VHYL and VYM, which provide more diversification, stability and relatively high reinvested dividends.
However, these more diversified or dividend-oriented ETFs also reduced the maximum portfolio performance compared to a strategy invested solely in QQQ.
As they say,”You can't win everywhere”.
👉 The portfolio of various ETFs therefore sought a compromise between growth, diversification and income.
And the proof is that it worked, because the return was slightly better than the S&P 500 for better diversification.
FIRE simulation: what happens with a monthly withdrawal?
The FIRE strategy generally consists of accumulating enough capital to finance some or all of one's expenses through one's portfolio.
In this simulation, let's imagine that each investor withdraws 0.5 % of his portfolio each month. This corresponds to a theoretical annual withdrawal rate of approximately 6 %.
Many FIRE sites suggest withdrawing 4% per year to reach FIRE, as this is considered more prudent. However, for the purposes of this article, let's use the example of a withdrawal of 0.5% per month (6% per year).
FIRE simulation with a monthly withdrawal of 0.5 %
Let's imagine that the three investors start with an initial capital of 100,000 USD and remove 0.5 % of the value of their portfolio each month for ten years.
Dividends are reinvested and no new contributions are made.
This simulation uses the historical annualized returns estimated in this article. Taxes, fees, and inflation are not taken into account.
Estimated result after ten years
| Initial amount | Strategy | Estimated annualized return | Estimated final value |
|---|---|---|---|
| 100,000 USD | S&P 500 – VOO | Approximately 14.8 % | Approximately USD 218,000 |
| 100,000 USD | Nasdaq 100 – QQQ | Approximately 19.5 % | Approximately USD 325,000 |
| 100,000 USD | ETF portfolio | Approximately 15.5 % | Approximately USD 232,000 |
During this historic period, the three investors reportedly continued to grow their capital despite monthly withdrawals.
The ranking would therefore be:
- QQQ – Nasdaq 100: around 325,000 USD after 10 years
- ETF portfolio: approximately USD 232,000 after 10 years
- VOO – S&P 500: approximately 218,000 USD after 10 years
The Nasdaq 100 would have delivered the best performance thanks to its superior historical return. The ETF portfolio would have come in second, slightly ahead of the S&P 500.
However, these results remain a simulation based on average historical returns. Markets move erratically, and future performance could be very different.
👉 This simulation shows that a withdrawal of 0.5 % per month, calculated on the current value of the portfolio, would have allowed the three strategies to continue to grow their capital during the period studied.
However, this simulation should be taken as an estimate, as the stock market varies according to several criteria (inflation, taxes, stock exchange fees, etc.).
FIRE simulation with real stock market fluctuations
The previous simulation used an average annual return applied regularly. However, the stock market does not move in a linear fashion.
Between January 2016 and December 2025, the markets experienced several periods of strong growth, but also significant declines, notably in 2018, 2020 and 2022.
For this new simulation, we take into account the historical fluctuations observed during the period studied.
Every investor starts with 100,000 USD and remove 0.5 % of the value of his portfolio each month. Dividends are included and withdrawals are made after portfolio performance.
Here is the estimated result after ten years:
| Strategy | Estimated value after ten years |
|---|---|
| S&P 500 – VOO | Approximately USD 225,000 |
| Nasdaq 100 – QQQ | Approximately USD 335,000 |
| ETF portfolio | Approximately USD 240,000 |
The ranking remains the same, and we conclude that the final result is even better for each strategy:
- Nasdaq 100 – QQQ: around 335,000 USD
- ETF portfolio: approximately USD 240,000
- S&P 500 – VOO: around 225,000 USD
It should be noted, however, that this period was particularly favorable for US stocks and large growth companies. These historical results do not guarantee future performance.
👉 This simulation is more realistic than a calculation based on a constant annual return, because it takes into account periods of rising and falling markets.
How do I withdraw money from my ETF portfolio each month?
With VOO or QQQ, withdrawing 0.5 % per month from the portfolio is very simple. The investor owns only one ETF and can sell a small portion of their position when they wish to withdraw money.
The diversified portfolio contains seven ETFs. Therefore, it is necessary to determine which ETFs to sell.
A simple method is to use withdrawals to rebalance the portfolio.
For example :
- If QQQ has increased significantly and represents more than 30% of the portfolio, the investor can sell a portion of QQQ.
- If MGK has become overweight (more than 10% in this case), it can also be sold.
This method allows you to withdraw money each month while gradually bringing the portfolio back towards its target allocation.
Taxation: growth or dividends
Taxation varies considerably depending on the country of residence. It's also important to note that each investor's tax situation is different.
In Switzerland, dividends are often taxed more heavily than capital gains.
Therefore, to summarize, The least taxed stock market strategy is the one that earns the most capital gains and receives the fewest dividends.
In this case, The Nasdaq 100 is the strategy that has paid less dividends than VOO or Investor 3's diversified portfolio, and has historically achieved the best return.
Which investment has the lowest fees?
The annual management fees, called TER, are generally low for the ETFs studied.
- The VOO ETF (S&P 500) has a very low TER of 0.03%
- QQQ is more expensive than VOO, but its fees remain modest compared to many active funds (0.20%)
- The portfolio composed of several ETFs has a weighted average cost that depends on the fees of each ETF; in this example, the average ETF fees are estimated at 0.10%
Summary of fees
| Strategy | Number of ETFs | Ease of management | Potential management fees |
| VOO | 1 | Very high | Very weak (0.03%) |
| QQQ | 1 | Very high | Quite weak (0.20%) |
| ETF portfolio | 7 | Average | Weak (approximately 0.10%) |
👉 VOO is the simplest and least expensive strategy to manage.
Conclusion: S&P 500, Nasdaq 100 or ETF portfolio: which strategy to choose?
Here is a summary of the three strategies.
| Question | Best Strategy |
| The easiest portfolio to manage | VOO or QQQ |
| The portfolio with the most stocks | ETF portfolio |
| The greatest geographical diversification | ETF portfolio |
| The best historical performance over the period studied | QQQ |
| The best historical compromise between growth and diversification | ETF portfolio |
| The lowest-cost strategy | VOO |
| The least technology-focused strategy | VOO |
| The strategy most focused on large growth stocks | QQQ |
| The most complex strategy to manage | ETF portfolio |
Key takeaways from this article
The Nasdaq 100 achieved its best historical performance during the period studied..
However, it is also more concentrated and heavily dependent on the performance of large, growing US companies.
The S&P 500 offers a very simple, inexpensive, and relatively diversified solution within the US market.
The portfolio composed of VOO, QQQ, VT, MGK, CHDVD, VHYL, and VYM has historically outperformed VOO. However, it has underperformed QQQ over the past decade.
Compared to VOO or QQQ ETFs, this portfolio offers a better balance between high-growth US stocks, international exposure, an allocation to Swiss equities, and a dividend-oriented component. It also delivers a slightly higher return than the VOO ETF.
However, it should be noted that it remains heavily focused on the United States and on large growth companies due to the overlap between VOO, QQQ, MGK, VT and VYM.
👉 The diversified portfolio is a very good compromise for aggressive investing, with a balance between the VOO, QQQ, VT, VYM and CHDVD ETFs. But it is also the most complicated portfolio to manage.
In summary, it is a US growth portfolio complemented by global, Swiss and high-dividend stocks.
FAQ: S&P 500, Nasdaq 100 and ETF Portfolio
❓ S&P 500 or Nasdaq 100: which one to choose to start with?
For a beginner investor, the S&P 500 may be easier to understand.
It offers exposure to approximately 500 major American companies and encompasses several economic sectors.
The Nasdaq 100 is more geared towards technology and growth companies.
It may offer higher yield potential, but it may also experience greater fluctuations.
👉 To start with a simple and diversified strategy in the United States, the S&P 500 can be an interesting solution.
❓ Is the Nasdaq 100 too risky for the long term?
The Nasdaq 100 isn't necessarily too risky for all investors. However, it is more concentrated than the S&P 500.
It is heavily dependent on the performance of certain large growth companies.
An investor must be able to:
- withstand sharp declines; ;
- preserve your investment during difficult times; ;
- avoid selling in a panic; ;
- accept that a strong past performance may not be repeated.
❓ Can you achieve financial freedom with an S&P 500 ETF?
Yes.
It is possible to achieve financial freedom with a portfolio consisting mainly of an S&P 500 ETF.
Success depends primarily on several factors:
- the amount invested; ;
- the savings rate; ;
- the investment period; ;
- annual expenses; ;
- the yield obtained; ;
- the withdrawal rate.
👉 It is not necessary to beat the Nasdaq 100 to achieve a FIRE target.
❓ Is the portfolio of seven ETFs truly diversified?
Yes, it is diverse in terms of the number of companies and regions. However, it also contains a lot of overlap.
VOO, QQQ and MGK own several large American companies in common.
VT and VYM also add exposure in the United States.
The portfolio is therefore more diversified than an investment solely in QQQ or VOO, but it remains heavily oriented towards large American companies.
❓ Should growth or dividends be prioritized for FIRE?
It depends on each investor's preferences and situation.
During the accumulation phase, the total growth of the portfolio is greater than the level of dividends.
During the withdrawal phase, dividends can provide a regular income and reduce the need to sell shares.
However, a dividend is not a free return. The total return remains the main element.
👉 A portfolio combining growth and dividends can offer an attractive compromise, but it is not automatically more efficient.
❓ Is withdrawing 0.5 % per month realistic?
A withdrawal equivalent to approximately 6 % per year may be high for a very long retirement.
The result depends in particular on:
- of future performance; ;
- inflation; ;
- of the duration of retirement; ;
- expenses; ;
- of the order of returns.
A poor period at the beginning of retirement can significantly reduce the lifespan of the portfolio.
On financial freedom websites, it is often stated that a withdrawal of 4% per year (0.333% per month) is more suitable for becoming financially free.
❓ Is a diversified portfolio necessarily more profitable?
No.
Diversification is primarily aimed at reducing the risk associated with a company, sector, or region.
It does not guarantee superior performance.
A concentrated portfolio can perform better during certain periods. However, it can also experience larger declines.
❓ Should we try to beat the market?
For many investors, trying to beat the market can lead to:
- more expenses; ;
- more transactions; ;
- timing errors; ;
- a strategy that is more difficult to maintain.
A simple and disciplined strategy can be more effective than a constant pursuit of top performance.
❓ What strategy is suitable for a minimalist investor?
A minimalist strategy should be:
- easy to understand; ;
- easy to manage; ;
- inexpensive; ;
- adapted to the investor's risk level; ;
- sufficiently diverse.
A single ETF may be sufficient for some investors.
Others will prefer to build a more personalized portfolio.
👉 The best wallet is not universal.
It's the one that matches your objectives and that you are able to hold onto during a stock market crash.
And you, what strategy would allow you to remain calmly invested during a drop of 30 or 40? 🤭
SP500, Nasdaq 100 or ETF portfolio: which strategy to choose?
Subscribe for the latest news ✍
You have a frugalist or minimalist project and you want a training? Click ”here”.
My pages
- About me
- Saving / Frugalism
- Blog
- Shop
- Contact
- Training and E-book
- Invest
- Minimalism
- My account
- Newsletter
- Basket
- Order confirmation
Lastest Post
- After 10 years of investing in ETFs: which ETF would I choose?
- Financial freedom: why the first 100,000 are the hardest
- The best advice in the world to save
- The Neon bank, the summary
- How does digitalization influence minimalist?
How does this blog live?
Overall, this blog lives on sharing a frugal and minimalist lifestyle.
For a question of transparency towards the readers. All recommended products are in order to make life cheaper, simpler and to promote the essentials.
Basically, my only income with this blog comes:
- Trainings that I realize
- Promo codes for the products I use
- Donations that readers make in exchange for neutral information.
About me
I decided to create this blog to develop and help readers who are looking for a simpler and more economical life.
Compared to before, I was a person who consumed a lot until the day I realized that my consumption made me sadder and poorer 😑
Now I prefer the minimum of my needs to be happy and achieve my financial freedom.
Without realizingI started to focus on saving and investing to depend on a boss for as little time as possible and to speed up my personal projects.
For several years I have felt happy and I have become richer in a way that I would never have imagined given that I have an average salary in Switzerland.
It is for this purpose that I decided to create this blog. In order to share and learn with other people who seek freedom and simplicity 😉
Are you rather minimalist or frugal Jonny?
I am as minimalist as I am frugalist. However, there are situations where I lean more towards an art of life.
To conclude, I think the most important thing is to feel comfortable in your lifestyle 😊
SP500, Nasdaq 100 or ETF portfolio: which strategy to choose?
Leave a Reply