
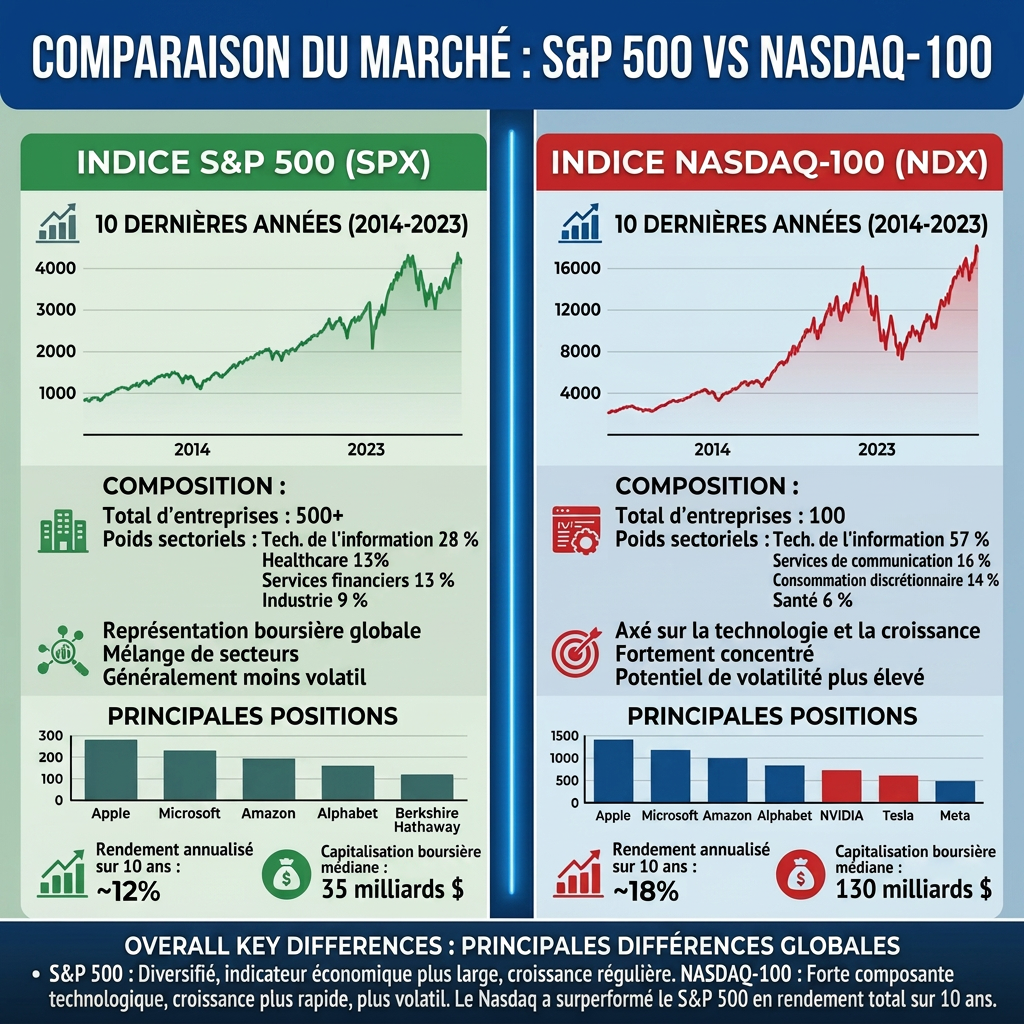
You want to invest in the American stock market, but You're hesitating between the S&P 500 and the Nasdaq Let's analyze this article, S&P 500 and Nasdaq: Differences and Performance in order to analyze These two indices are among the best known in the world and allow investment in large American companies. Note that their composition, level of diversification, return potential, and volatility are very different.
Recommended products


Introduction: S&P 500 and Nasdaq: Differences and Performance
The S&P 500 and the Nasdaq are among the best-known US stock market indices. They are often used by investors who want exposure to large US companies.
However, these two indices do not function in the same way. The S&P 500 is broader and more diversified, while the Nasdaq-100 is more focused on technology companies and high-growth firms.
In this article, you will compare the S&P 500 and the Nasdaq according to four main criteria:
- diversification
- historical performances
- dividends
- ETF fees
- Beta value
⚠️ The data presented in this article is historical. Past performance is not indicative of future results. Investing in the stock market involves a risk of capital loss.
What are the main differences between the S&P 500 and the Nasdaq?
The S&P 500
The S&P 500, also called S&P500 or SP500, is a stock market index composed of approximately 500 large companies listed in the United States.
The S&P500 offers relatively broad exposure to the US economy. The companies that make it up belong to different sectors, for example:
- technology
- finance
- health
- energy
- real estate
The technology sector occupies an important place in the index, but the S&P 500 does not depend solely on this sector.
Thanks to its large number of companies and sector diversification, the S&P 500 is often considered a representative index of large American companies.
The Nasdaq-100
The Nasdaq is primarily an American stock exchange located in New York. However, when investors refer to the "Nasdaq" in the context of ETF investments, they are generally referring to the Nasdaq-100.
The Nasdaq-100 comprises approximately 100 of the largest non-financial companies listed on the Nasdaq market.. The index is heavily exposed to the technology, communications and consumer sectors.
It includes major companies such as Apple, Microsoft, Nvidia, Amazon and Meta.
The Nasdaq-100 is therefore more concentrated than the S&P 500.. Its evolution depends more on the performance of large technology companies and growth companies.

S&P 500 vs Nasdaq: Summary of Key Differences
Here is an initial comparison between the S&P 500 and the Nasdaq-100:
| Criteria | S&P 500 | Nasdaq-100 |
|---|---|---|
| Number of companies | Approximately 500 | Approximately 100 |
| Diversification | Higher | More limited |
| Exposure to technology | Important | Very important |
| Concentration | Weaker | Higher |
| Potential volatility | Generally more moderate | Generally higher |
| Profile | Extensive exposure to major American companies | Growth and technology focus |
The S&P 500 and the Nasdaq-100 both play an important role in global financial markets. However, they do not necessarily serve the same investment objectives.
Main stocks of the S&P 500 and Nasdaq
To better understand the composition of these indices, it is helpful to observe their main positions.
The weightings below show the data from the historical version of this article in August 2026. They change regularly according to market movements and index changes.
Main stocks of the S&P 500
Example based on the VOO ETF:
- Apple: 7.25 %
- Microsoft: 6.75 %
- Nvidia: 6.11 %
- Amazon: 3.56 %
- Meta: 2.56 %
Main stocks of the Nasdaq-100
Example based on the QQQM ETF:
- Apple: 8.64 %
- Nvidia: 8.54 %
- Microsoft: 7.77 %
- Broadcom: 5.27 %
- Meta: 5.08 %
This data shows that the two indices share several large companies. The main difference lies in their level of concentration.
At the time of writing this article, The top 5 stocks in the S&P 500 represent approximately 26% of the total portfolio, while those in the Nasdaq-100 represent approximately 35%.
Indeed, The Nasdaq-100 generally allocates a larger portion of its portfolio to its largest companies.. As a result, returns and volatility are more heavily influenced by a few tech giants.
First conclusion: the S&P 500 is more diversified
The S&P 500 offers an advantage in terms of diversification.
Compared to the Nasdaq-100, the S&P 500:
- contains approximately 400 additional companies
- covers more economic sectors
- depends less on the performance of the technology sector
- generally has a lower concentration in its main positions.
In the data used for this article, the three largest companies in the Nasdaq accounted for approximately 25% of the index, compared to approximately 20% for the S&P 500. This difference may seem small, but it shows that the Nasdaq-100 is more dependent on the performance of its largest companies.
In truth, each strategy depends on your objective:
- Diversify your portfolio and gain broader exposure to the US economy = the S&P 500
- Being exposed only to the 100 largest US stocks according to Nasdaq and accepting higher volatility = Nasdaq-100

What was the performance of the S&P 500 and the Nasdaq?
After comparing their composition, another question arises: Which index performed best?
For this historical comparison, the performance of the S&P 500 and the Nasdaq was analyzed over a ten-year period, between November 2014 and November 2024.
The results for this period are:
- S&P 500: approximately +182 %
- Nasdaq: approximately +380 %
Over this specific period, the Nasdaq therefore achieved a performance far superior to that of the S&P 500.
However, it is important to put these figures into context.
Historical performance is highly dependent on the selected period. A period marked by strong growth in technology companies can benefit the Nasdaq-100.
Furthermore, higher performance can be accompanied by greater fluctuations. The Nasdaq-100 can therefore experience sharper declines during periods of volatility or market correction.
Second conclusion: the Nasdaq achieved its best historical performance
Between November 2014 and November 2024, the Nasdaq recorded a historical performance superior to that of the S&P 500.
According to the data used in this article:
- S&P 500: approximately +182 1TP3Q; ;
- Nasdaq: approximately +380 %.

blue = S&P 500
What dividends do the S&P 500 and Nasdaq offer?
Dividends are another important factor for some investors.
Companies in the S&P 500 have historically paid out more dividends than those in the Nasdaq-100.. This is explained in particular by the presence of many established companies in sectors such as finance, health, industry or energy.
In the historical data used for this article:
- S&P 500: approximately 1.4 % dividend yield; ;
- Nasdaq: approximately 0.7 % dividend yield.
The dividends of the S&P 500 were therefore about twice as high as those of the Nasdaq.
Third conclusion: the S&P 500 has historically paid out more dividends.
In this historical comparison, The S&P 500 offers a higher dividend yield than the Nasdaq.
The S&P 500 may therefore be more attractive to investors who value distributed income.
However, dividend yield should not be analyzed in isolation. It is also important to consider capital growth, fees, diversification, and risk level.

What are the fees for tracking the S&P 500 and Nasdaq with an ETF?
To invest in the S&P 500 or the Nasdaq-100, one of the simplest solutions is to use an ETF.
An ETF, or exchange-traded fund, generally seeks to replicate the performance of an index. By buying a single ETF share, you can gain exposure to numerous companies.
ETF management fees are usually expressed as the TER, or Total Expense Ratio.
The higher the TER (Total Efficiency Ratio), the more money the investor loses. Choosing an ETF with a low TER is therefore essential!
Examples of ETFs tracking the S&P 500
| AND F | Management company | Country of residence | historic TER indicated |
|---|---|---|---|
| VOO* | Vanguard | UNITED STATES | 0,03 % |
| P500 | Invesco | Ireland | 0,05 % |
| VUSA | iShares | Ireland | 0,05 % |
Examples of ETFs on the Nasdaq-100
| AND F | Management company | Country of residence | historic TER indicated |
|---|---|---|---|
| QQQ* | Invesco | UNITED STATES | 0,30 % |
| QQQM | Invesco | UNITED STATES | 0,15 % |
| CSNDX | iShares | Ireland | 0,33 % |
The fees shown are historical figures and may change. It is therefore recommended to check the information directly in the ETF's official document before investing.
In this comparison, We conclude that S&P 500 ETFs have lower TER fees than Nasdaq-100 ETFs!
However, other criteria must also be taken into account, for example:
- the country of domicile of the ETF
- taxation
- the motto
- brokerage fees.
Fourth conclusion: ETFs tracking the S&P 500 are often cheaper
In the examples presented, theETFs tracking the S&P 500 have lower management fees than ETFs tracking the Nasdaq-100.
This difference can have an impact on long-term net return, especially when the investment is held for several years.
However, the TER should not be the sole selection criterion. A cheaper ETF is not automatically the best choice for all investors.

The beta value of the S&P 500 and the Nasdaq: which index is more volatile?
After comparing diversification, historical performance, dividends and ETF fees, there remains a fifth important criterion to analyze: the beta value.
Beta allows us to estimate an investment's sensitivity to market fluctuations and its level of diversification. In other words, it indicates whether an index tends to move more or less strongly than its benchmark market.
What is beta value?
The beta value is generally interpreted as follows:
- Beta equals 1 : the investment generally moves in line with its benchmark index
- Beta less than 1 Investment has historically tended to fluctuate less sharply than the market.
- Beta greater than 1 Investment has historically tended to fluctuate more sharply than the market.
- Negative beta : investment has historically tended to move in the opposite direction to the market.
For example, an asset with a beta of 1,20 historically, it tends to vary by about 1.20% when its reference market varies by 1%. This relationship is a statistical estimate and does not constitute a forecast.
The S&P 500 as a benchmark
The S&P 500 is often used as a benchmark index to measure the behavior of the US market.
By convention, its beta is generally considered to be close to 1 when compared to itself.
This means that the S&P 500 often represents the benchmark used to analyze the sensitivity of another index or stock to movements in the US market.
The beta of the Nasdaq-100
The Nasdaq-100 has historically had greater exposure to technology companies and growth companies.
These companies may be more sensitive:
- to interest rate fluctuations
- to economic growth expectations
- at high valuations
- to changes in investor confidence
Therefore, The Nasdaq-100 generally exhibits higher volatility than the S&P 500.. When compared to the S&P 500, its historical beta is often higher than 1.
This means that the Nasdaq-100 may tend to rise more strongly during favorable periods, but also to experience larger declines during periods of correction.
Comparison of risk between the S&P 500 and the Nasdaq
| Criteria | S&P 500 | Nasdaq-100 |
|---|---|---|
| Beta relative to the S&P 500 | Approximately 1 | Generally greater than 1 |
| Historical volatility | More moderate | Higher |
| Sectoral diversification | More importantly | More limited |
| Exposure to technology | Important | Very important |
| Sensitivity to high-tech stocks | Weaker | Higher |
| Upside potential | More balanced | Potentially higher |
| Risk of sharp declines | Generally more moderate | Potentially more important |
Fifth conclusion: the S&P 500 is generally less volatile
The beta analysis confirms the differences already observed between the two indices.
The S&P 500 is generally more diversified and less concentrated on technology companies. Its performance is therefore often more balanced. and its volatility may be more moderate.
The Nasdaq-100 generally has a higher beta than the S&P 500. It can therefore react more strongly to market movements, both upward and downward.
If you are looking for more balanced exposure to the US market and want to limit the volatility of your portfolio, the S&P 500 may be preferable.
- If you accept greater variations in order to pursue higher growth potential, the Nasdaq-100 may be more suitable.
- If you're looking for a balance between growth and volatility, the S&P 500 is more suitable.

S&P 500 or Nasdaq: which index to choose?
To summarize this comparison, here are the four main results:
| Criteria | Index that has the advantage in this comparison |
|---|---|
| Better diversification | S&P 500 |
| Best historical performance between 2014 and 2024 | Nasdaq |
| Historically higher dividend yield | S&P 500 |
| ETFs with the lowest fees in the examples shown | S&P 500 |
| More moderate volatility and beta | S&P 500 |

My opinion on the S&P 500 and the Nasdaq
Both the S&P 500 and the Nasdaq-100 can be attractive for long-term investment in the US market.
In reality, the choice depends mainly on your objectives, your investment horizon and your risk tolerance.
👉 The S&P 500 could be a relevant solution if you are looking for:
- better diversification
- a broader exposure to the American economy
- a lesser dependence on the technology sector
- potentially more moderate volatility
👉 The Nasdaq-100 might be a better fit for your profile if you're looking for :
- a strong exposure to technology companies
- greater growth potential
- a strategy geared towards growth companies
- and if you accept potentially higher concentration and volatility
For a long-term retirement or financial independence goal, the S&P 500 can provide a more diversified base..
Conversely, The Nasdaq-100 may be interesting if you want to give more space to technology companies in your portfolio, if you want higher return potential over the long term and you accept potentially larger fluctuations.
It is also possible to combine the two indices. However, it's important to remember that they already own several large companies together. Therefore, buying both doesn't necessarily mean achieving significantly greater diversification.
Conclusion
If you prioritize diversification and broad exposure to the United States, the S&P 500 may be more suitable.
If you are looking for more growth and accept potentially higher volatility, the Nasdaq-100 may be a better fit for you.
Before investing, always analyze your objectives, your investment horizon, your risk tolerance, the fees and the applicable taxes.
FAQ: S&P 500 or Nasdaq
What is the difference between the S&P 500 and the Nasdaq?
The S&P 500 comprises approximately 500 large U.S. companies and offers broader exposure to various economic sectors. The Nasdaq 100 comprises approximately 100 large non-financial companies listed on the Nasdaq stock exchange and is more focused on technology and growth companies.
Is the S&P 500 more diversified than the Nasdaq?
Yes. The S&P 500 contains more companies and covers a wider range of economic sectors. It is generally less concentrated on large technology companies than the Nasdaq-100.
Is the Nasdaq performing better than the S&P 500?
Over the historical period analyzed between 2014 and 2024, the Nasdaq outperformed the S&P 500. However, past performance is not indicative of future results and results may vary depending on the period studied.
Is the Nasdaq riskier than the S&P 500?
The Nasdaq-100 is generally more concentrated in technology and growth companies. This concentration can lead to higher volatility and greater swings than the S&P 500.
Does the S&P 500 pay out more dividends than the Nasdaq?
Historically, the S&P 500 has offered a higher dividend yield than the Nasdaq-100. This is largely due to the presence of mature companies from diverse sectors. However, yields can change over time.
Can you invest in the S&P 500 with an ETF?
Yes. An S&P 500 ETF allows you to track the performance of the index and invest indirectly in a large number of American companies with a single position.
Can you invest in the Nasdaq with an ETF?
Yes. Several ETFs allow you to track the Nasdaq-100. These ETFs provide significant exposure to large technology companies and US growth companies.
Which ETF should I choose between the S&P 500 and the Nasdaq?
The choice depends on your objectives. An S&P 500 ETF might be suitable if you're looking for more diversified exposure to the US market. A Nasdaq-100 ETF might be appropriate if you want greater exposure to technology companies and are comfortable with potentially higher volatility.
Are S&P 500 ETFs cheaper than Nasdaq ETFs?
In the examples presented in this article, S&P 500 ETFs have lower management fees. However, fees vary depending on the ETF and are subject to change. It is therefore important to check the TER (Total Expense Ratio) and other fund characteristics before investing.
Is it possible to invest in both the S&P 500 and the Nasdaq?
Yes, but the overlap between the two indices must be taken into account. They have several large companies in common. Investing in both therefore often increases exposure to the same companies, particularly large technology firms.
Is the S&P 500 suitable for long-term investment?
The S&P 500 is often used in long-term investment strategies due to its diversification and exposure to large US companies. However, it remains subject to market fluctuations and carries a risk of capital loss.
Is the Nasdaq suitable for long-term investment?
The Nasdaq-100 can be used in a long-term strategy, particularly by investors seeking significant exposure to technology companies. However, its level of concentration and potentially higher volatility should be taken into account.
Should you choose the S&P 500 or the Nasdaq to prepare for retirement?
There's no one-size-fits-all answer. The S&P 500 can offer a more diversified base, while the Nasdaq-100 is more growth-oriented. The choice depends on your investment horizon, risk tolerance, and the overall composition of your portfolio.
Which is the better investment: the S&P 500 or the Nasdaq?
No single index is inherently better. The S&P 500 has an advantage in terms of diversification, while the Nasdaq-100 has outperformed over certain historical periods. The best choice depends on your goals and risk tolerance.
Do the past performances of the S&P 500 and Nasdaq guarantee future returns?
No. Past performance is never indicative of future results. The value of investments can go up or down, and it is possible to lose some or all of the capital invested.
S&P 500 and Nasdaq: Differences and Performance
Subscribe for the latest news
You have a frugalist or minimalist project and you want a training? Click ”here”.
My pages
- About me
- Saving / Frugalism
- Blog
- Shop
- Contact
- Training and E-book
- Invest
- Minimalism
- My account
- Newsletter
- Basket
- Order confirmation
Lastest Post
- Investing Abroad: What the Exchange Rate Doesn't Tell You
- How to optimize your 2nd pillar?
- 2nd pillar: The basics to understand
- Top 5 tips to make money from home
- How to invest 1200 CHF – Simplified version
How does this blog live?
Overall, this blog lives on sharing a frugal and minimalist lifestyle.
For a question of transparency towards the readers. All recommended products are in order to make life cheaper, simpler and to promote the essentials.
Basically, my only income with this blog comes:
- Trainings that I realize
- Promo codes for the products I use
- Donations that readers make in exchange for neutral information.
About me
I decided to create this blog to develop and help readers who are looking for a simpler and more economical life.
Compared to before, I was a person who consumed a lot until the day I realized that my consumption made me sadder and poorer 😑
Now I prefer the minimum of my needs to be happy and achieve my financial freedom.
Without realizingI started to focus on saving and investing to depend on a boss for as little time as possible and to speed up my personal projects.
Are you rather minimalist or frugal Jonny?
I am as minimalist as I am frugalist. However, there are situations where I lean more towards an art of life.
SP500 and Nasdaq: Differences and Performances
Leave a Reply